What “840 Times More Likely to Get Sick from Raw Milk” Actually Measures
The statistic appears in news coverage, legislative testimony, and public health warnings with remarkable regularity: raw milk causes 840 times more illness than pasteurized milk. It is sourced to a real, peer-reviewed study. The math behind it is not fabricated. But the figure answers a much narrower question than the way it gets used, and it almost never travels with the footnotes it requires. Understanding what it actually measures changes the picture considerably.
Where the number comes from
The 840x figure originates from Costard et al. 2017, published in Emerging Infectious Diseases, a CDC-affiliated journal. The study examined dairy-related outbreaks in the United States between 2009 and 2014, focusing on four pathogens: Salmonella, Campylobacter, Shiga toxin-producing Escherichia coli (STEC), and Listeria monocytogenes.
The authors calculated an incidence rate ratio (IRR), a statistical measure comparing how often illness occurs per unit of exposure in two groups. In this case, the unit of exposure was one billion servings. The result: unpasteurized dairy products produced outbreak-related illness at a rate 840 times higher per billion servings than pasteurized dairy products, with a 95% credibility interval of 611 to 1,158.
That range matters. The 840x figure is a modeled mean estimate with substantial uncertainty on either side, not a precise measurement. When the number is cited in media coverage or testimony, the credibility interval is almost never included.
The figure also applies to all unpasteurized dairy combined: fluid milk and cheese bundled together. Raw cheese and products like kefir have different consumption patterns and pathogen exposure profiles than fluid milk, and the paper does not separate them cleanly in the IRR calculation. The 840x figure is not specific to raw milk alone.
What the study does not measure
The 840x figure does not represent the probability that a specific person who drinks raw milk will get sick. It is not a comparison between raw milk and other foods. It does not capture total illness burden, only outbreak-reported cases. It covers four specific pathogens, not all pathogens. And it makes no distinction between high-quality and low-quality raw milk production.
Each of these omissions matters. Sporadic foodborne illness (cases that occur outside of recognized outbreaks) accounts for the vast majority of all foodborne illness. The study explicitly limits itself to outbreak-reported cases, which are a fraction of actual illness for every food category, not just raw milk.
Per-serving versus per-consumer
The choice of denominator (servings rather than consumers) has a significant effect on the result, and is worth examining carefully.
A per-serving ratio asks: given one serving of each product, how do the risks compare? This is a useful metric for certain kinds of risk assessment, particularly when comparing foods consumed at similar frequencies by similar populations.
A per-consumer ratio asks: among people who actually drink raw milk versus people who drink pasteurized milk, how often do they get sick? This is closer to what most people mean when they ask whether raw milk is dangerous.
The per-consumer picture looks different. The same Costard et al. paper establishes that 3.2% of the US populationconsumes raw milk, more than 10 million people as of 2014. The study attributes approximately 761 outbreak-related illnesses per year to raw milk. That works out to roughly 0.007% of raw milk consumers getting sick annually, about 1 in 14,250.
Per consumer, the risk profile of raw milk is low in absolute terms, and lower than several commonly consumed foods. Per-consumer illness rates for leafy greens run approximately 0.82%, chicken around 0.45%, and raw oysters around 0.35%, all substantially higher than raw milk’s 0.007%.
Why the per-serving framing produces a large ratio
Raw milk is consumed in relatively small total volume by a small fraction of the population. Pasteurized milk is consumed in enormous volume by nearly the entire country. When illness counts are divided by servings rather than by consumers, the small denominator for raw milk and the massive denominator for pasteurized milk produce a ratio that looks dramatic even when the absolute illness counts are modest.
This is not a flaw in the Costard study. The authors are transparent about what they measured. The problem arises when the figure gets extracted from its methodological context and presented as a general statement of danger, without the per-serving qualifier that defines it.
The outbreak-only limitation
Both the raw milk and pasteurized milk illness estimates in Costard et al. derive from outbreak surveillance data: cases that were formally investigated by public health departments and attributed to a specific food source. Most foodborne illness is never reported, investigated, or attributed.
CDC estimates that for every reported foodborne illness, many more go undetected. This underreporting affects all food categories. For raw milk, outbreaks may be disproportionately investigated relative to other foods due to heightened regulatory attention, which could inflate the apparent ratio. This is not established definitively, but it is a recognized limitation of outbreak-based surveillance as a method for comparing risks across food categories.
What the 96% figure means
Closely related to the 840x claim is the frequently cited statistic that raw milk causes 96% of dairy-related illnesses. This comes from the same Costard paper and is arithmetically accurate within its frame: among outbreaks linked to dairy products, raw milk and raw cheese account for 96% of cases while being consumed by only 4.8% of the population combined.
What the 96% figure does not say is that dairy illness is a large public health problem in absolute terms. The total annual outbreak-related illness burden from all dairy combined (pasteurized and unpasteurized) is approximately 760 cases per year in the Costard dataset. 96% of a small number is still a small number. For comparison, leafy greens are associated with an estimated 2.3 million illnesses annually.
What the data does support
None of this means raw milk carries zero risk. Unpasteurized milk can harbor pathogenic bacteria, and the Costard data clearly shows that raw dairy products produce more outbreak-related illness per serving than pasteurized products. That is a real finding.
It is also worth noting that the outbreak case profile skews toward vulnerable populations: the very young, the elderly, and the immunocompromised. Healthy adults who are the primary intentional raw milk consumers are not well-represented in the outbreak data. The aggregate risk figure does not map cleanly onto the risk faced by a healthy adult sourcing milk from a clean, well-managed operation.
What the data does not support is the use of the 840x figure as a standalone risk statement divorced from context. It doesn’t disclose that it is a per-serving ratio derived from modeled outbreak data, that it covers four pathogens and six years of surveillance, that it bundles fluid milk with cheese, or that the per-consumer illness rate from the same paper is 0.007%.
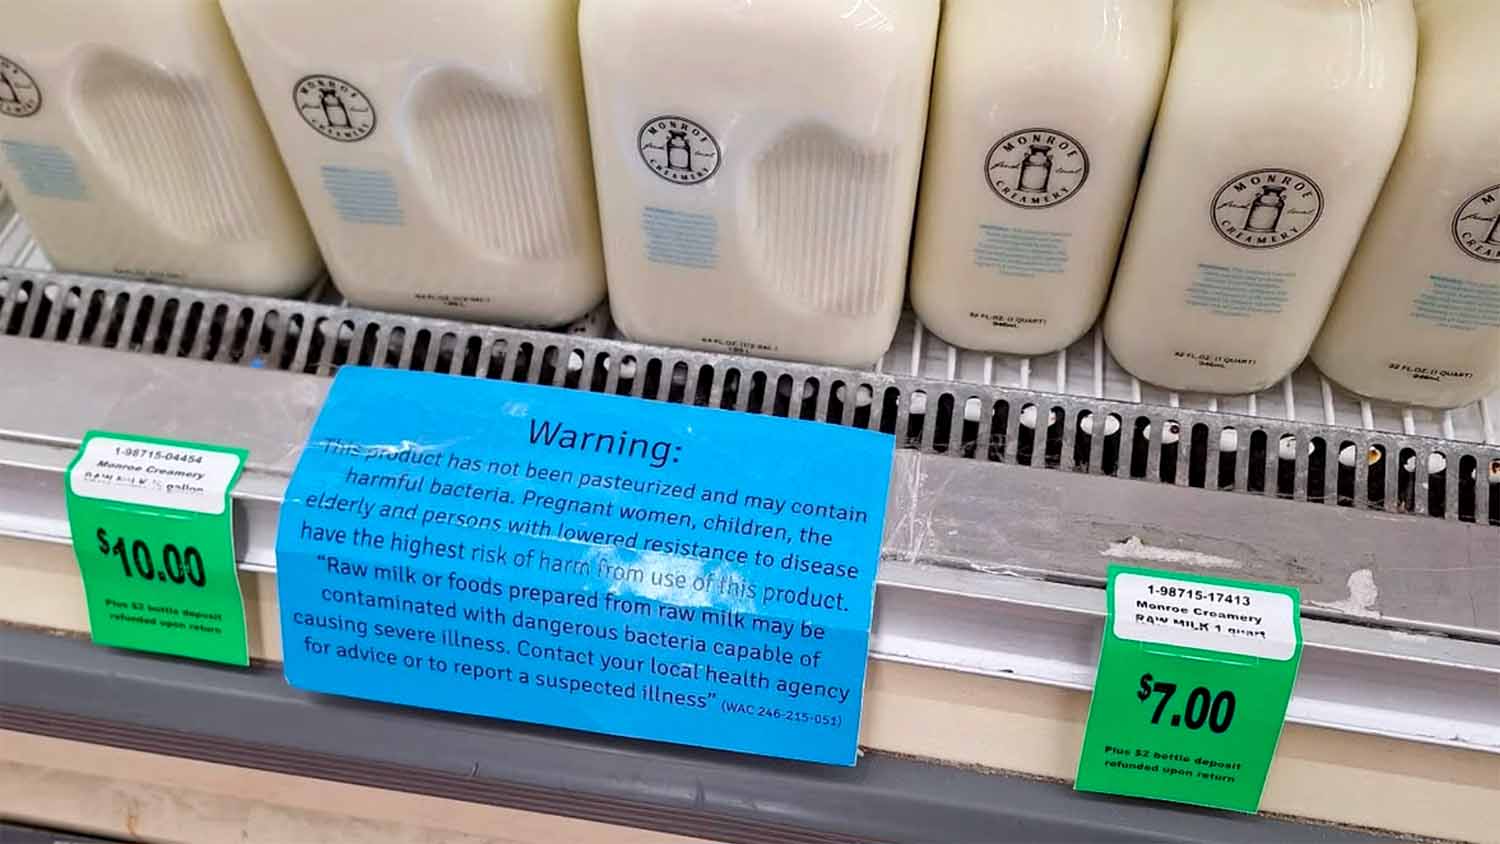
Consumers sourcing raw cow milk, raw goat milk, raw sheep milk, or other raw dairy products from farms with strong sanitation practices are working with a different risk profile than the aggregate dataset implies. The Costard data pools all raw milk sources together: clean, well-managed operations alongside those responsible for identified outbreaks. Farms certified through programs like RAWMI operate under testing and sanitation standards that are not reflected in population-level outbreak statistics.
What to ask when you see the figure cited
The 840x figure is a real result from a real study. It measures outbreak-reported illness per billion servings of unpasteurized versus pasteurized dairy, across four pathogens, from 2009 to 2014, with a credibility interval of 611 to 1,158. When it appears without that context in a news article, a legislative hearing, or a public health advisory, the appropriate questions are: is this per serving or per consumer? Does it include sporadic illness or only outbreaks? Does it compare raw milk to other foods, or only to pasteurized milk?
The per-consumer illness rate for raw milk, 0.007% or roughly 1 in 14,250 consumers per year, comes from the same paper and actually answers the question most people are asking. Both numbers are real. They are not in conflict. They answer different questions, and the question being asked should determine which one gets cited.
For a broader per-consumer comparison of raw milk illness rates against leafy greens, chicken, and raw oysters, see Comparing Raw Milk Foodborne Illness Data with Other Foods.